In this post I will document one method for producing a high-level frequency table visualization of average memory and CPU utilization values of a set of servers. This level of reporting is intended for discussions with management.
The raw data has 12 months of data for 33 host machines. The data is in an Excel file with one worksheet.
The Excel worksheet has five columns.
- Cluster: generic cluster name values
- ESXIHost: generic host name values
- Date: the day
- CPUDailyAverageValue: average percent CPU utilization for the day
- MEMDailyAverageValue: average percent memory utilization for the day
| Cluster | ESXiHost | Date | CPUDailyAverageValue | MEMDailyAverageValue |
| Cluster1 | ESXiHost01 | 9/8/21 | 17.40999985 | 36.81000137 |
| Cluster1 | ESXiHost01 | 9/9/21 | 18.60000038 | 36.93999863 |
| Cluster1 | ESXiHost01 | 9/10/21 | 18.20999908 | 36.95999908 |
| Cluster1 | ESXiHost01 | 9/11/21 | 16.62999916 | 36.97000122 |
The first step is to install the ImportExcel module from the PowerShell Gallery if you don’t have it already. After installation run Get-Command -Module ImportExcel to confirm it installed correctly. You should see something like this.
CommandType Name Version Source
———– —- ——- ——
Alias Convert-XlRangeToImage 7.8.4 ImportExcel
Alias Export-ExcelSheet 7.8.4 ImportExcel
Alias New-ExcelChart 7.8.4 ImportExcel
Alias Set-Column 7.8.4 ImportExcel
Alias Set-Format 7.8.4 ImportExcel
Alias Set-Row 7.8.4 ImportExcel
Alias Use-ExcelData 7.8.4 ImportExcel
…
#Create an in-memory Excel Object to work with.
$report = ‘.\vmwareClusterReport.xlsx’
$excelRpt = Open-ExcelPackage -Path $report -create
#Remove report file if it exists.
Remove-Item $report -ErrorAction SilentlyContinue
#Add the required worksheets
Add-WorkSheet -ExcelPackage $excelRpt -WorksheetName ‘RawData’
Add-WorkSheet -ExcelPackage $excelRpt -WorksheetName ‘CPUData’
Add-WorkSheet -ExcelPackage $excelRpt -WorksheetName ‘CPUPivot’
Add-WorkSheet -ExcelPackage $excelRpt -WorksheetName ‘MEMData’
Add-WorkSheet -ExcelPackage $excelRpt -WorksheetName ‘MEMPivot’
#Import the sample data into PowerShell.
$workingSet = Import-Csv .\sampleWorkingSet.csv
#working set is a PowerShell custom object with NoteProperties containing the column data.
#Include the original data in the report workbook.
$excelRpt = $workingSet | Export-Excel -ExcelPackage $excelRpt -WorksheetName ‘RawData’ -TableName ‘RawData’ -AutoFilter -PassThru
#Now modify the working set by adding two new columns that will hold the rounded integer values of the average #CPU and memory utilization values.
$workingSet | Add-Member -NotePropertyName ‘CPU’ -NotePropertyValue 0
$workingSet | Add-Member -NotePropertyName ‘MEM’ -NotePropertyValue 0
$workingSet | %{$_.CPU = [int]([math]::Round($_.CPUDailyAverageValue))}
$workingSet | %{$_.MEM = [int]([math]::Round($_.MEMDailyAverageValue))}
#The CPU and MEM columns have values constrained to the integer values 0 – 100.
#Next step is to group the data by Cluster and by ESXiHost for each MEM and CPU value.
$groupedByCpu = $workingset | select Cluster, ESXIHost, CPU | Group-Object Cluster, ESXiHost, CPU
$groupedByMEM = $workingset | select Cluster, ESXIHost, MEM | Group-Object Cluster, ESXiHost, MEM
#The “groupBy” variables now have PowerShell GroupInfo objects with grouping as shown above, along with the #count of the number of occurrences of each group.
#Now to create objects that can easily be exported as Excel worksheets.
$cpuTable = $groupedByCPU | % {$a=$_.name -split ‘, ‘;[PScustomobject]@{Cluster=$a[0];ESXiHost=$a[1];CPU=$a[2];Count= $_.Count}}
$cpuTable = $cpuTable | Sort-Object -Property Count
$memTable = $groupedByMEM | % {$a=$_.name -split ‘, ‘;[PScustomobject]@{Cluster=$a[0];ESXiHost=$a[1];MEM=$a[2];Count= $_.Count}}
$memTable = $memTable | Sort-Object -Property Count
$excelRpt = $cpuTable | Export-Excel -ExcelPackage $excelRpt -WorksheetName ‘CPUData’ -TableName ‘CPUData’ -AutoFilter -PassThru
$excelRpt = $MEMTable | Export-Excel -ExcelPackage $excelRpt -WorksheetName ‘MEMData’ -TableName ‘MEMData’ -AutoFilter -PassThru
By using some of the more advanced functions in ImportExcel, the visuals can be created automatically.
This is what the final visual should look like for CPU. The X axis is the CPU value, Y axis is the count for each server, and the colors are the part that each ESXi host plays in the overall count of each CPU value. The chart is filtered by cluster, in this case Cluster4. A glance at this chat is all that’s required to identify that Cluster4 was not CPU constrained during the data collection 12-month period. Also, at a glance, it is clear the overall cluster CPU load is evenly distributed. Filter which values are shown on the chart to bring into focus the results that are meaningful to the point you want to make during the management review.

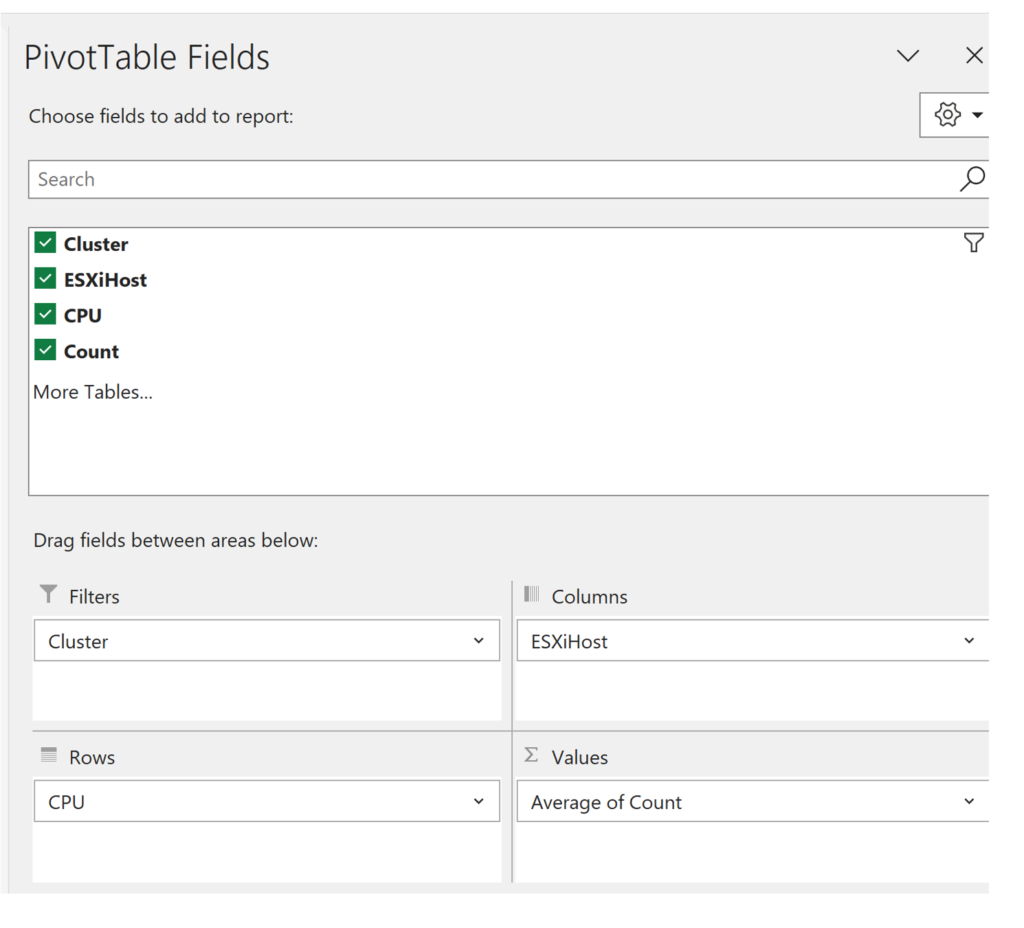
Here are the manually configured Pivot settings for the chart directly above.

Don’t be confused by the “Average of Count” in the Values block. It is an average of one value.
Now that the target pivot table and pivot chart has been designed the ImportExcel commands to create the Excel objects can be employed.
The Add-PivotTable cmdlet of the ImportExcel module is complex with many options. Because of this it is a good practice to do as much of the work as possible to prepare the data for use by this cmdlet. A review of the full Help for it is required reading for this next bit.
#This creates the CPU pivot table and chart in the excel package.
$cpuPivotTableParams = @{
PivotTableName = ‘CPUPivotTable’
Address = $excelRpt.CPUPivot.cells[“a1”]
SourceWorkSheet = $excelRpt.CPUData
PivotRows = @(“CPU”)
PivotColumns = @(‘ESXiHost’)
PivotData = @{‘Count’ = ‘Average’}
PivotTableStyle = ‘Light21’
}
$memPivotTableParams = @{
PivotTableName = “MEMPivotTable”
Address = $excelRpt.MEMPivot.cells[“a1”]
SourceWorkSheet = $excelRpt.MEMData
PivotRows = @(“MEM”)
PivotColumns = @(“ESXiHost”)
PivotData = @{‘Count’ = ‘Average’}
PivotTableStyle = ‘Light21’
}
Add-PivotTable @CPUPivotTableParams -PassThru -IncludePivotChart -ChartType ‘ColumnStacked’ -NoTotalsInPivot
Add-PivotTable @MEMPivotTableParams -PassThru -IncludePivotChart -ChartType ‘ColumnStacked’-NoTotalsInPivot Close-ExcelPackage $excelRpt